Final assigment
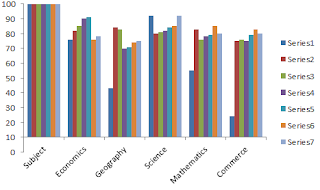
Pass % of Students in different subject Subject 1990 1991 1992 1993 1994 1995 1196 Economics 76 82 85 90 91 76 78 Geography 43 84 83 70 71 74 75 Science 92 80 81 82 84 85 92 Mathematics 55 83 76 78 79 85 80 Commerce 24 75 76 75 79 83 80 2. description: The above chart and bar graps show the pass percentage of 5 subjects from year 1990 to 1996 The chart display the total pass percentage of 5 different subjects near and bar graph represents the pass percentage from 1990-1996 overall commerce subject gradually increased to pass % where geography and science remained constants and mathematics ans commerce remained fluctuated

