Final assigment

| Pass % of Students in different subject | |||||||
| Subject | 1990 | 1991 | 1992 | 1993 | 1994 | 1995 | 1196 |
| Economics | 76 | 82 | 85 | 90 | |||
| 91 | 76 | 78 | |||||
| Geography | 43 | 84 | 83 | 70 | 71 | 74 | 75 |
| Science | 92 | 80 | 81 | 82 | 84 | 85 | 92 |
| Mathematics | 55 | 83 | 76 | 78 | 79 | 85 | 80 |
| Commerce | 24 | 75 | 76 | 75 | 79 | 83 | 80 |
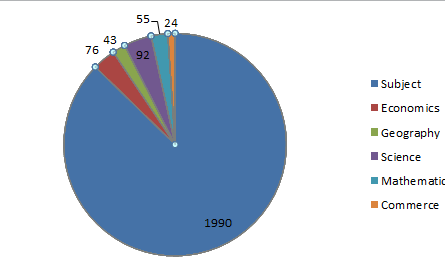
2. description:
The above chart and bar graps show the pass percentage of 5 subjects from year 1990 to 1996
The chart display the total pass percentage of 5 different subjects near and bar graph represents the pass percentage from 1990-1996 overall commerce subject gradually increased to pass % where geography and science remained constants and mathematics ans commerce remained fluctuated

Comments
Post a Comment